
Sales Dashboard |

|

|

|
|
Sales Dashboard |
|
|

|
Sales Dashboard |
|
|
|
|
Sales Dashboard |
|
|
|
The Daily Dashboard is a quick and easy way to see critical business information for the day. This screen can be used as a reference on how the business is doing for a date. If the selected date is today's date, this shows the information as of the current time for today.
![]()
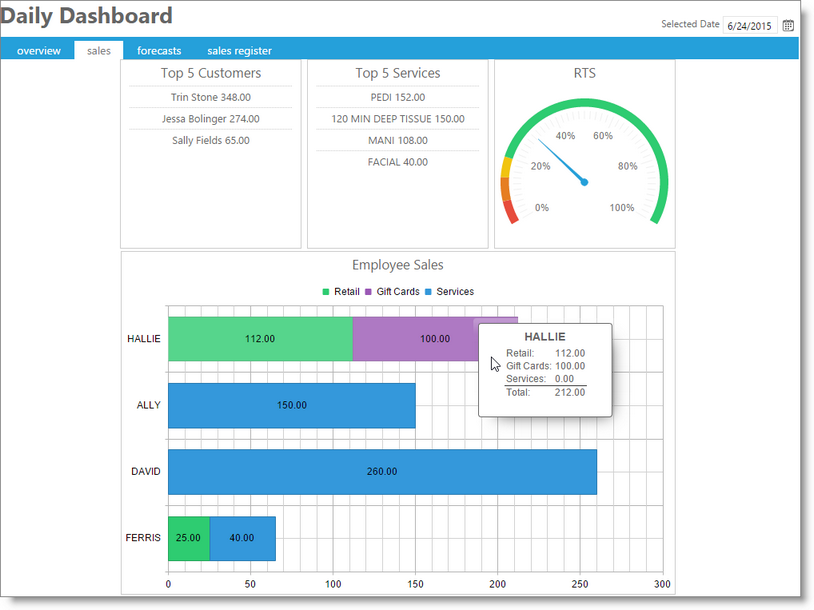
Top 5 Customers
The five clients who have spent the most money on the selected day will show here.
Top 5 Services
The five services that have earned the most money on the selected day will show here.
RTS
This small graph shows the business's retail to service percentage for the selected date.
Employee Sales Graph
This section shows the sales by each employee, broken down into the types of items sold. Hovering over an employee on this graph will open a detailed breakdown.
